How many people are looking for work?
Unemployment, 186 countries & territories. Share of the labour force without work but available for and seeking employment (ILO modelled estimate).
lowest≥ 2.7%≥ 3.3%≥ 4.8%≥ 5.8%≥ 8.3%≥ 11.8% no data
Source: ILO Modelled Estimates database (ILOEST)… via World Bank· 2021 / 2025
Dots sit on a scale from the lowest (0.1%) to the highest value (34.2%).
The ranking
- 1
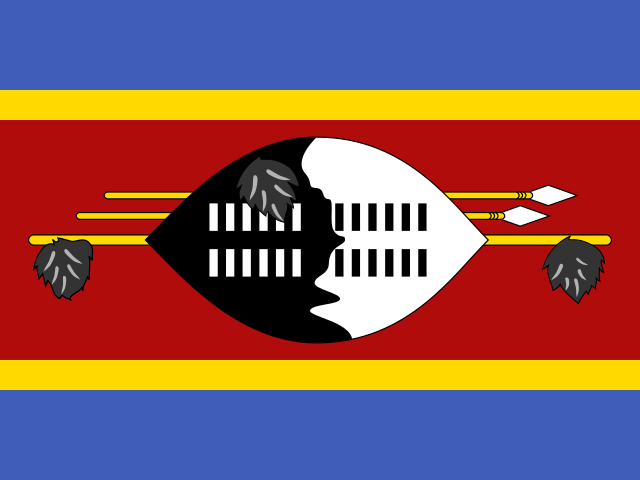 Eswatini 34.2% 2025
 - 2
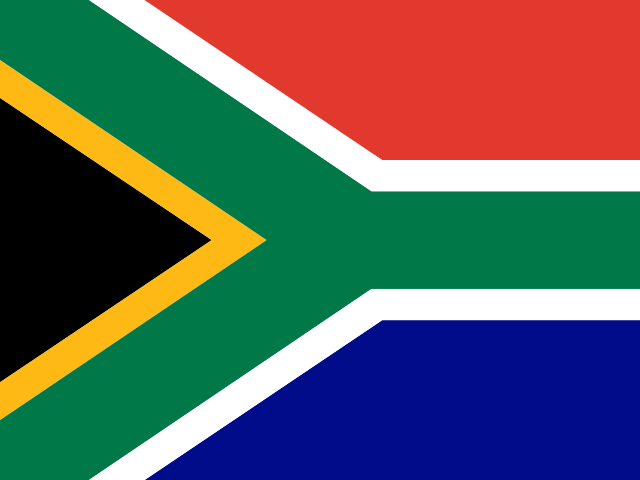 South Africa 32.4% 2025
 - 3
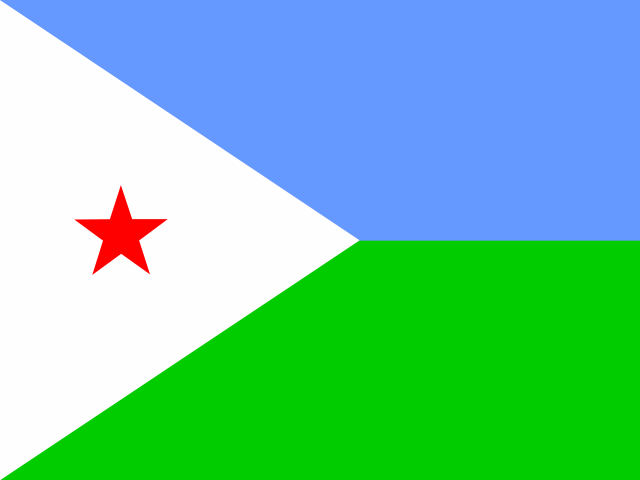 Djibouti 26% 2025
 - 4
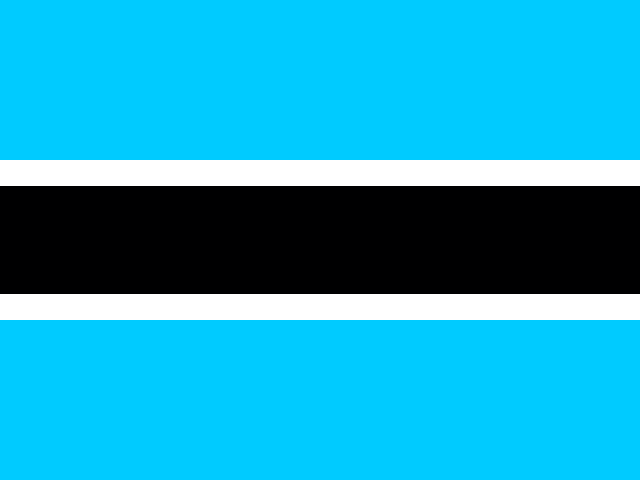 Botswana 24.5% 2025
 - 5
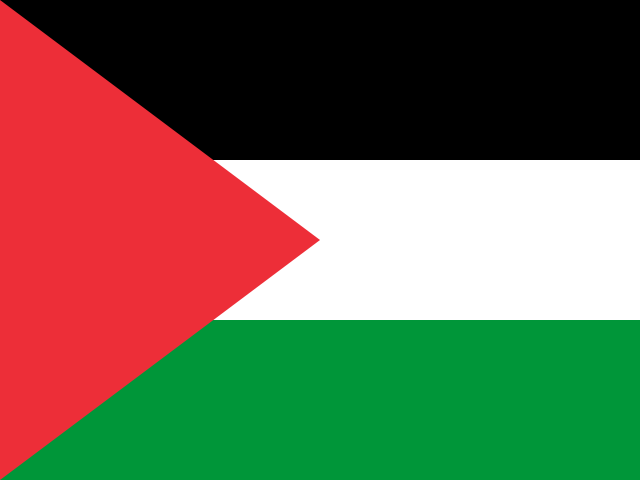 Palestine 24.4% 2022
 - 6
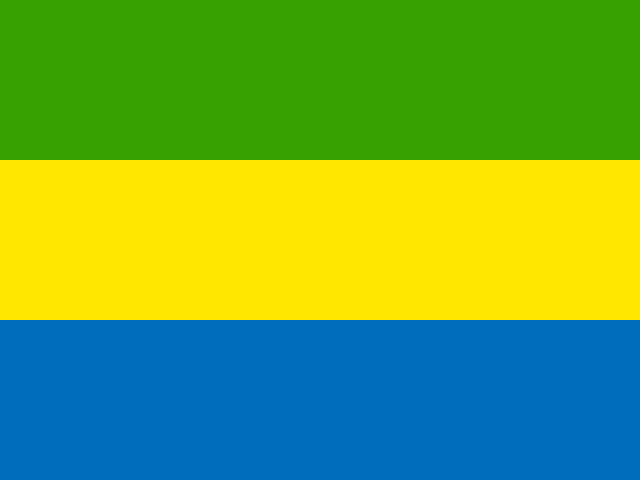 Gabon 20.2% 2025
 - 7
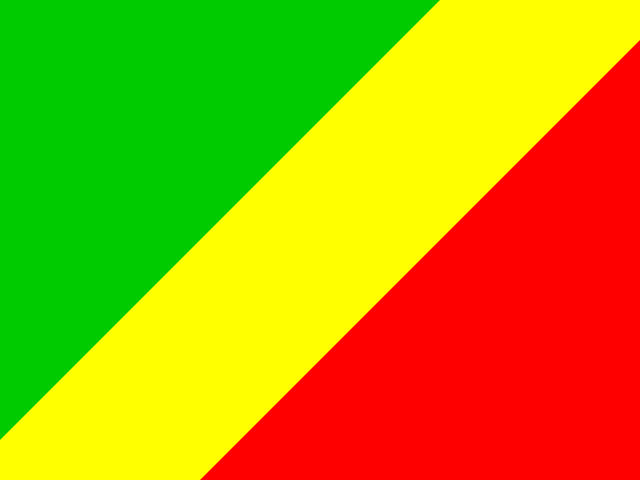 Congo 19.9% 2025
 - 8
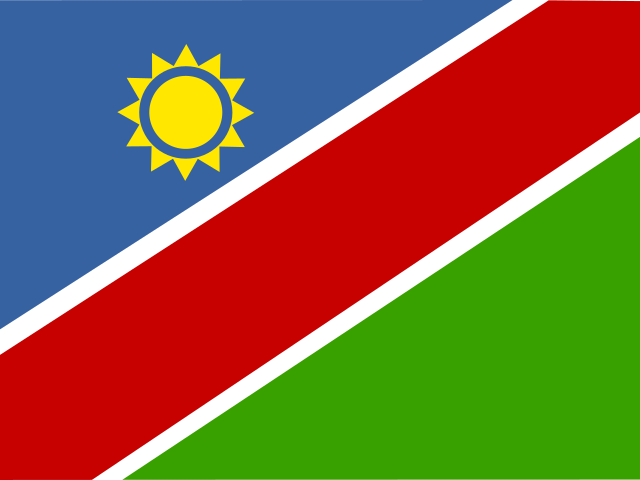 Namibia 19.3% 2025
 - 9
 Somalia 18.9% 2025
 - 10
 Libya 18.8% 2025
 - 11
 Saint Vincent and the Grenadines 18% 2025
 - 12
 Yemen 17.3% 2025
 - 13
 Jordan 16.5% 2025
 - 14
 Lesotho 16.3% 2025
 - 15
 Iraq 15.5% 2025
 - 16
 Tunisia 15.1% 2025
 - 17
 Haiti 14.9% 2025
 - 18
 Angola 14.1% 2025
 - 19
 Montenegro 13.6% 2025
 - 20
 Syria 13.6% 2025
 - 21
 Afghanistan 13.4% 2025
 - 22
 Armenia 12.9% 2025
 - 23
 South Sudan 12.4% 2023
 - 24
 North Macedonia 12.3% 2025
 - 25
 Georgia 12.1% 2025
 - 26
 Guyana 12% 2025
 - 27
 Cape Verde 11.9% 2025
 - 28
 French Polynesia (France) 11.7% 2025
 - 29
 Algeria 11.6% 2025
 - 30
 United States Virgin Islands (United States) 11.4% 2025
 - 31
 Rwanda 11.4% 2025
 - 32
 New Caledonia (France) 11.2% 2025
 - 33
 Bosnia and Herzegovina 11% 2025
 - 34
 Lebanon 11% 2023
 - 35
 Albania 10.9% 2025
 - 36
 Nepal 10.5% 2025
 - 37
 Spain 10.4% 2025
 - 38
 Mauritania 10.3% 2025
 - 39
 Ukraine 9.8% 2021
 - 40
 Finland 9.5% 2025
 - 41
 Saint Lucia 9.5% 2025
 - 42
 Zimbabwe 9.3% 2025
 - 43
 Bahamas 9.2% 2025
 - 44
 São Tomé and Príncipe 9.1% 2025
 - 45
 Morocco 9% 2025
 - 46
 Chile 9% 2025
 - 47
 Belize 8.9% 2025
 - 48
 Sweden 8.7% 2025
 - 49
 Greece 8.5% 2025
 - 50
 Türkiye 8.5% 2025
Reference years differ by country (2021–2025); each row shows its own year.