How expensive is it?
Price level (US = 100), 198 countries & territories. How far a US dollar goes: the general price level of goods and services compared with the United States (= 100), computed as GDP per person at market exchange rates ÷ GDP per person at purchasing-power parity (World Bank). This is the price level ratio of the PPP conversion factor to the exchange rate — an economy-wide measure, not an expat cost-of-living index for rents or city prices.
lowest≥ 30%≥ 35%≥ 41%≥ 48%≥ 62%≥ 83% no data
Source: CountryDuel calculation from World Bank WDI· 2015 / 2025
The ranking
 Bermuda (United Kingdom)
 Iceland
 Cayman Islands (United Kingdom)
 Switzerland
 Barbados
 Nauru
 Israel
 United States
 Micronesia
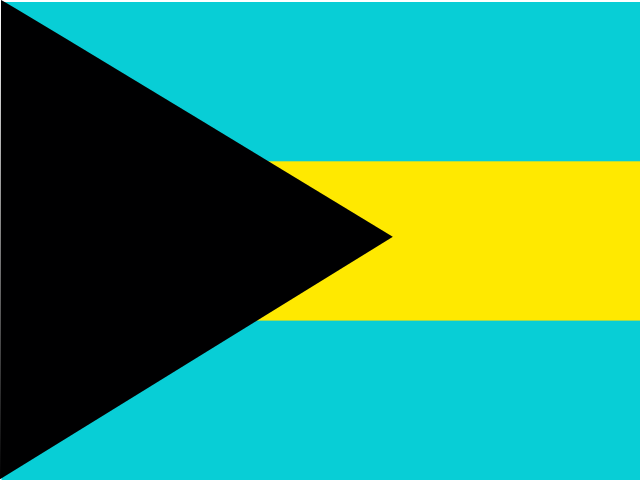 Bahamas
 Marshall Islands
 Luxembourg
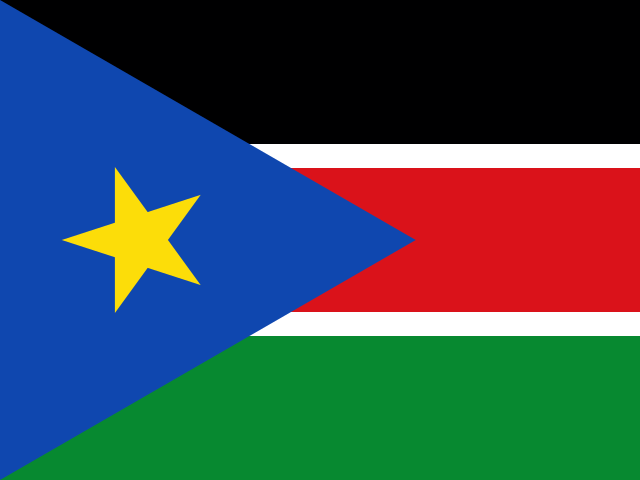 South Sudan
 Denmark
 Norway
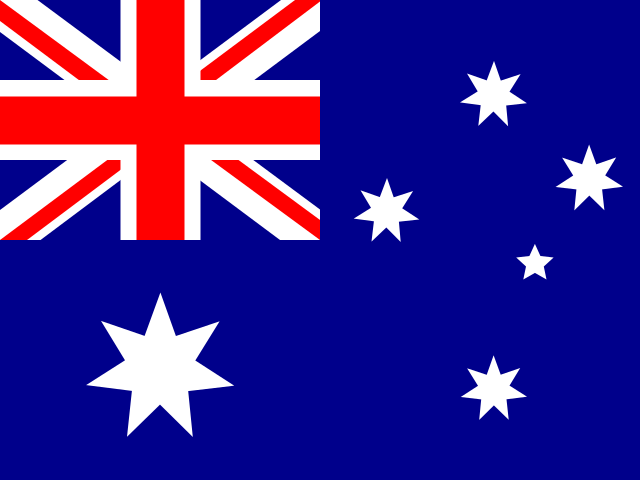 Australia
 Faroe Islands (Denmark)
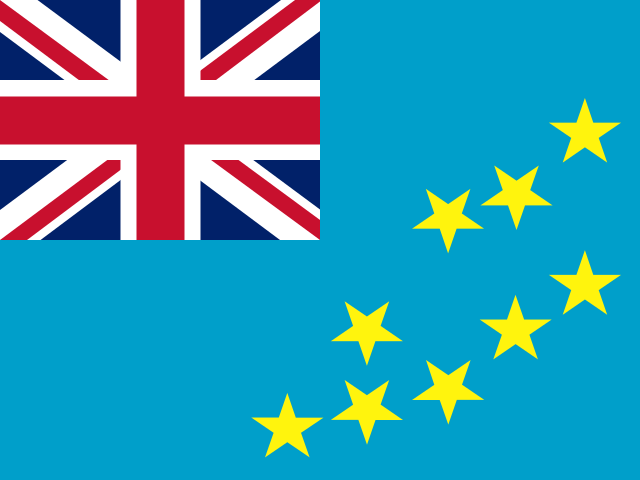 Tuvalu
 Vanuatu
 United Kingdom
 United States Virgin Islands (United States)
 Sweden
 New Zealand
 Haiti
 Finland
 Ireland
 Palau
 Netherlands
 Canada
 Austria
 Belgium
 Germany
 Puerto Rico (United States)
 France
 San Marino
 Tonga
 Solomon Islands
 Aruba (Netherlands)
 Greenland (Denmark)
 Hong Kong (China)
 Curaçao (Netherlands)
 Antigua and Barbuda
 Italy
 Saint Kitts and Nevis
 Andorra
 Malta
 Estonia
 Uruguay
 Kiribati
 Japan
Reference years differ by country (2015–2025); each row shows its own year.